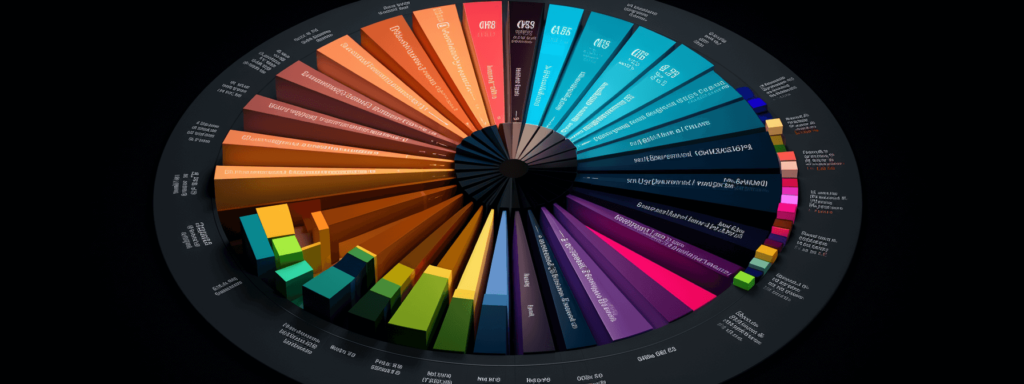
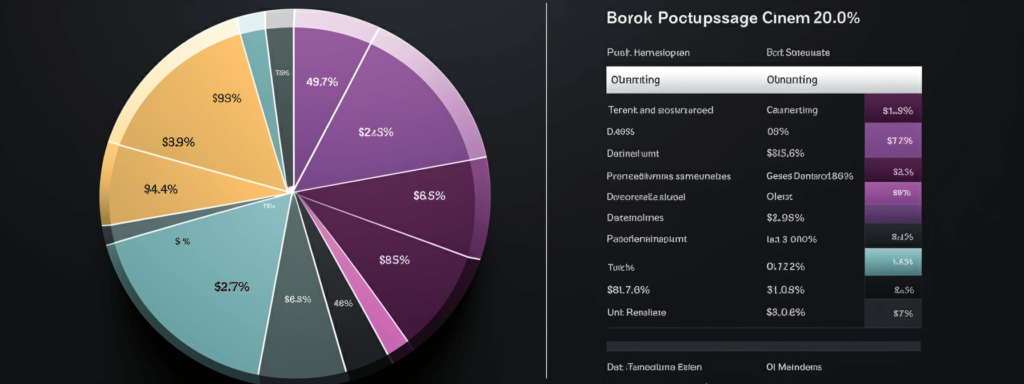
As data continues to play an increasingly integral role in driving strategic decisions, being able to visualize and interpret it becomes even more vital. An effective tool that has aided this cause is the pie chart. Named for its resemblance to a pie divided into slices, the pie chart is a simple yet powerful means of visualizing data. In this article, we delve deeper into the intricacies of pie charts and how they enhance our data comprehension.
Decoding the Concept of Data Visualization

Data visualization is the process of representing data or information graphically to simplify complex scenarios and provide insights. Its significance lies in its ability to enable decision-makers to see analytics presented visually, which aids in comprehending difficult concepts or identifying new trends. With interactive visuals, users can more distinctively grasp patterns, changes, and critical aspects.
In our era of digital transformation, where data generation is rampant, efficient data visualization can provide a clear idea of what the data means by providing a visual representation of the information. In doing so, it highlights the trends and patterns that might go unnoticed in text-based data.
Technological advancement has led to the development of various data visualization tools. Among these tools, a pie chart is one of the most effective graphic representations, allowing easy comparison of quantities each data category holds in a dataset.
The Intricacy of Pie Charts in Data Display
A pie chart is a circular statistical graphic divided into slices to illustrate numerical proportions. Each slice, representing a category, proportionally displays numerical data. The entire pie illustrates the total data set, while the individual slices showcase the relative proportions of the parts to the whole. In essence, a pie chart breaks down a single dataset into its components, and this simplicity is what makes it so widely used.
The pie chart is a convenient tool for data conveyance due to its visual characteristics. At a quick glance, viewers can understand the division of the parts and get a sense of the data distribution. Especially in instances where the fraction differences are significant, a pie chart provides an immediate visual difference in magnitude.
While pie charts are mainly used to present percentage or proportional data, they can also effectively demonstrate datasets that highlight when one category markedly dominates others. This ability to subtly draw attention to substantial differences is a value-added feature of pie charts, proving useful in a wide range of practical applications.
Superiority of Pie Charts in Showcasing Proportional Data
Pie charts’ distinct advantage over other data visualization forms is their innate ability to display proportional and percentage data. As the entire pie represents the total data, each slice’s size is proportional to its respective data quantity. This enables quick proportions perception, making it easier to digest and analyze data.
Pie charts can be incredibly useful for data representation when gaining a fast, intuitive comparison of different categories is crucial. They can offer immediate visual cues about the significant trends and patterns within the dataset, given the data’s proportionality and the simplicity of the pie chart structure.
Practical Instances of Pie Charts Enhancing Data Comprehension

Pie charts find a wide range of practical applications. One frequent use of pie charts is seen in business resource planning, where pie charts can display the resource allocation divisions. Not only does it offer clear visibility, but it also illustrates the significant sectors, thus enabling informed decision-making.
In healthcare sectors, pie charts can help represent data, such as disease prevalence among different age groups or geographic locations. This clear and concise representation can aid in quick decision-making, a trait highly valuable in healthcare settings.
Pie charts have found usefulness in presenting survey results, simplifying fraction representations for easy understanding. Whether for business, medical, or sociological purposes, the utility of pie charts in enhancing data comprehension is indisputable.